

Note: To ensure a smooth user experience, we’re rolling out this feature in stages.
Initially, it will be available to customers with fewer than 60 servers on their account. This phased approach allows us to fine-tune performance and provide a seamless improvement for all.
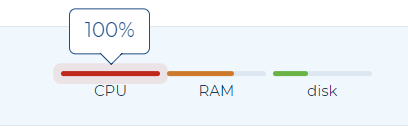
With this release we are improving the overview of the Hypernodes by showing health status of your CPU, RAM and disk per server.
Those metrics shows what is your current load of the resource.
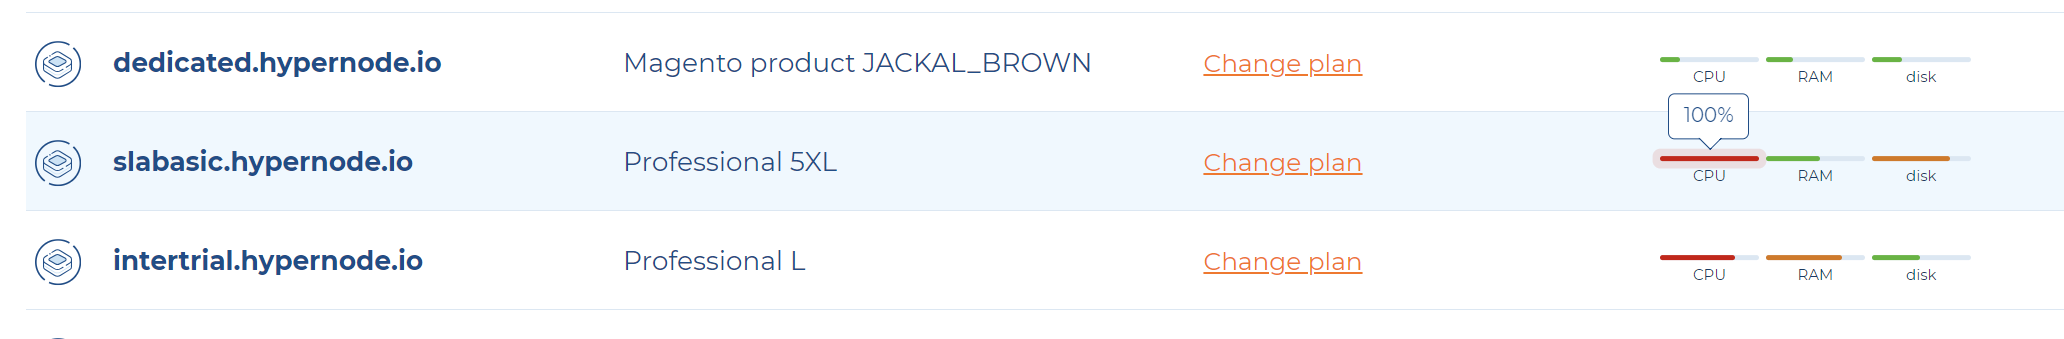
Below you will find a short explanation how to interpret the metrics:
1. Green load
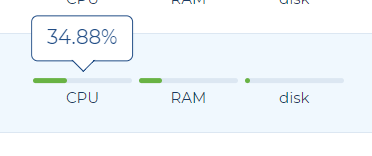
When your resource is green, nothing to worry about, on hover you can see the average load percentage on your CPUs. For example, if your actual load is 1, but you have 3 CPUs, then your load percentage is 33%.
2. Yellow / orange load
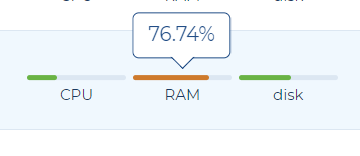
Still a safe resource load, but better to keep an eye on it for more hectic and busy times.
3. Red load or overload
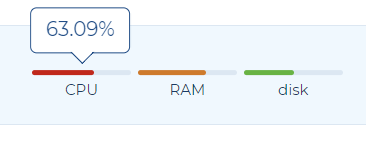
If your resource is red it indicates potential problems with your server, performance or overall experience for your customers. It’s meant to help you plan more busy periods in your shop, so the server will perform as expected. It’s worth to check if the resource is on a high load for a long time, or is it a sudden bump.
If your resource is overloaded it needs immediate action and investigation if it’s on a high load for a long time or is it a sudden bump. Leaving any of the resources overloaded can bring up issues with your webshop’s performance, transactions or even SEO.
To get the more details overview how to fix overloaded resources see our docs What overloaded CPU/RAM or disk means and how to prevent that?