

With this release, we are excited to announce a cool new feature on the Hypernode platform: remote debugging.
With remote debugging, one can connect to a Hypernode and start debugging while the application doesn’t take a performance hit!
How does this work? When you enable the php_xdebug_enabled setting, we spin up a separate php-fpm instance which has Xdebug enabled. Requests containing the Xdebug cookie from the Xdebug helper extension, will be routed to the Xdebug php-fpm instance.
Getting started
To enable remote debugging, you first have to enable the Xdebug setting:
app@cj8jlz-example-magweb-cmbl:~$ hypernode-systemctl settings php_xdebug_enabled True --block
After that, you need to open a reverse SSH tunnel so that Xdebug on the Hypernode can communicate with PhpStorm on your local machine:
$ ssh -R 9003:localhost:9003 app@example.hypernode.io -N
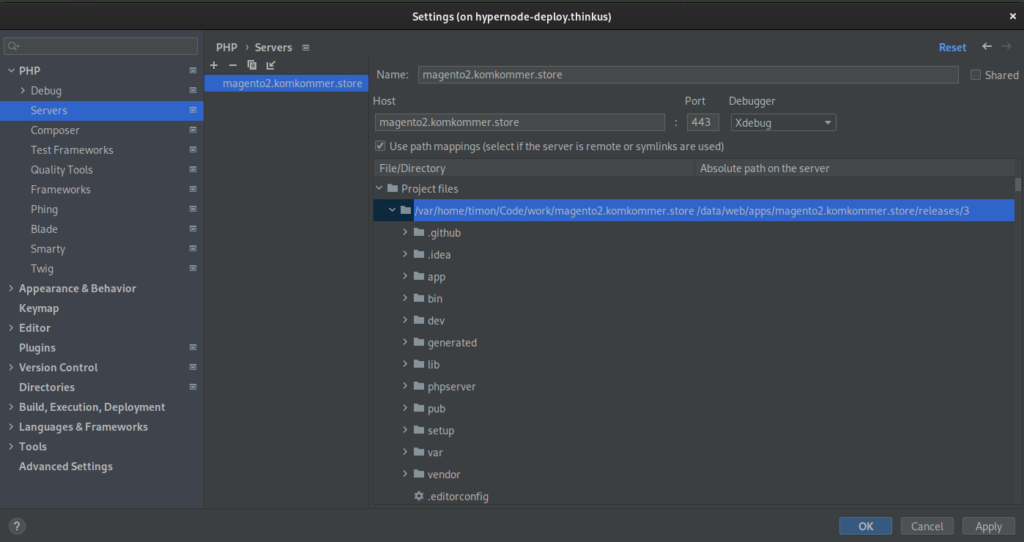
Then you open up your PhpStorm project and go to your File -> Settings -> PHP -> Servers . Click the + button to add a server and fill Name and Host with the full domain name of the site you want to debug (for example www.shop.com). Then check the box Use path mappings and click on the right column next to your project root. Here you can fill in the absolute path of the application on the remote server, for example:
/data/web/magento2/data/web/apps/myshop/releases/3
Hint: if you’re making use of a multi deployment structure (like with Hypernode Deploy) and want to know what the absolute path for your current directory is, you can use realpath to find out:
app@cj8jlz-example-magweb-cmbl:~$ realpath apps/magento2.komkommer.store/current
/data/web/apps/magento2.komkommer.store/releases/3
Finally click the ‘Start Listening for PHP Debug Connections’ button. Now your debug environment is ready to go.
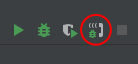
To start debugging, make sure you have the Xdebug helper extension enabled in your browser:
After installation, go to the URL of the application you want to debug and click the Xdebug helper icon and click Debug. The icon should become green and now your requests will be directed to the php-fpm instance with Xdebug enabled.
Place a breakpoint in your IDE, reload the page or execute the action you want to debug and you should see a popup from PhpStorm asking about path mappings. In this dialog you should configure the absolute path on the server for you project, for example /data/web/magento2. Click OK and your IDE should be landing your breakpoint (if it doesn’t but you want to verify if your configuration is correct, select Run -> Break at first line in PHP scripts).
JetBrains has way more knowledge and information on this topic, so we advise you to go visit their documentation to learn more:
Varnish bypass
While remote debugging works with Varnish enabled, you might want to bypass Varnish when debugging.
We can very easily do that by creating a second VCL. First dump your current VCL to a separate file:
app@j6ysu4-example-magweb-aws:~$ varnishadm vcl.list
available cold/cold 0 boot
active warm/warm 0 magento2
app@j6ysu4-example-magweb-aws:~$ varnishadm vcl.show magento2 > ~/magento2_debug.vcl
Now change the magento2_debug.vcl file by adding the following right under the std.collect(req.http.Cookie); statement:
app@j6ysu4-example-magweb-aws:~$ diff -u ~/magento2.vcl ~/magento2_debug.vcl
--- /data/web/magento2.vcl 2022-11-30 13:37:15.128024944 +0000
+++ /data/web/magento2_debug.vcl 2022-11-30 14:15:54.623168927 +0000
@@ -81,6 +81,11 @@
# collect all cookies
std.collect(req.http.Cookie);

+ # bypass if xdebug session
+ if (req.http.cookie ~ "XDEBUG_SESSION=[a-zA-Z]+") {
+ return (pass);
+ }
+
# Compression filter. See https://www.varnish-cache.org/trac/wiki/FAQ/Compression
if (req.http.Accept-Encoding) {
if (req.url ~ "\.(jpg|jpeg|png|gif|gz|tgz|bz2|tbz|mp3|ogg|swf|flv)$") {
Then load and activate the magento2_debug.vcl configuration:
app@j6ysu4-example-magweb-aws:~$ varnishadm vcl.load magento2_debug /data/web/magento2_debug.vcl
VCL compiled.
app@j6ysu4-example-magweb-aws:~$ varnishadm vcl.use magento2_debug
VCL 'magento2_debug' now active
Now you should be bypassing the Varnish cache when you have the Xdebug cookie set.
Final note
We hope to have informed you enough to go ahead and try it out!
If you run into any problems, please let us know by contacting Hypernode Support. We’re happy to help :-).
Happy debugging!