We just released a new version of the “My Hypernode” page which introduces an overview of settings applied to your Hypernode as well as an overview of graphs showing the performance of your Hypernode.
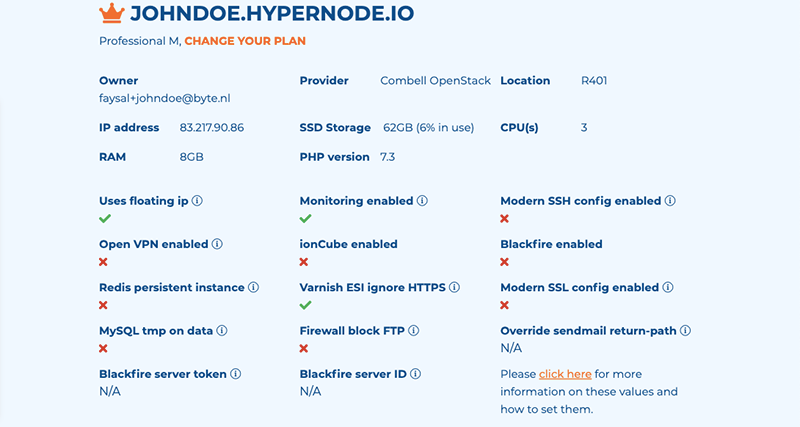
Applied settings
This overview indicates which settings are set for your Hypernode such as MySQL version or PHP version. We wanted to provide a clear overview of all the settings that have been applied for your Hypernode. Some settings will have an information icon next to them. Clicking these will provide you with a a description for these settings.
If you find these valuestoo distracting you can easily hide them by clicking the up arrow on the section dividing the settings and graphs. You can click the down arrow below your Hypernode’s specifications to show them again.
For now it’s not possible to change the values of these settings on this page.
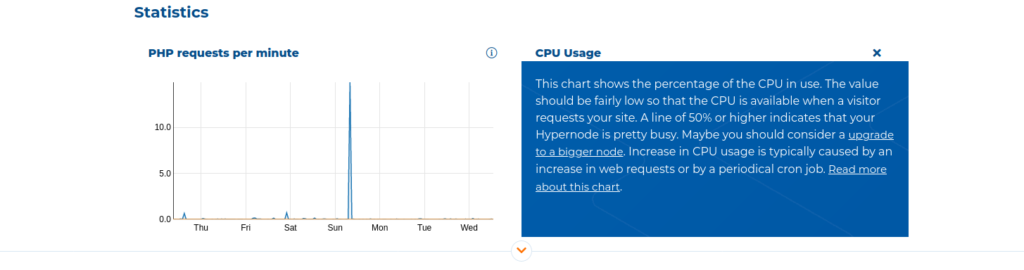
Graphs
The new My Hypernode page now shows graphs related to your Hypernode’s performance. The following metrics are available:
-
- PHP requests per minute
- CPU usage
- Long running processes
- Memory in use
- Disk usage
- Average response time
- Redis memory in use
By default only the first two graphs/metrics are shown. You can show the other graphs by clicking the down arrow below these graphs. If you find the list of graphs to distracting you can collapse them again by clicking the up arrow below the graphs. There is also an information icon for each graph, clicking this will show a description of what the graph represents.