

We have been hard at work at improving Insights in the last couple of months.
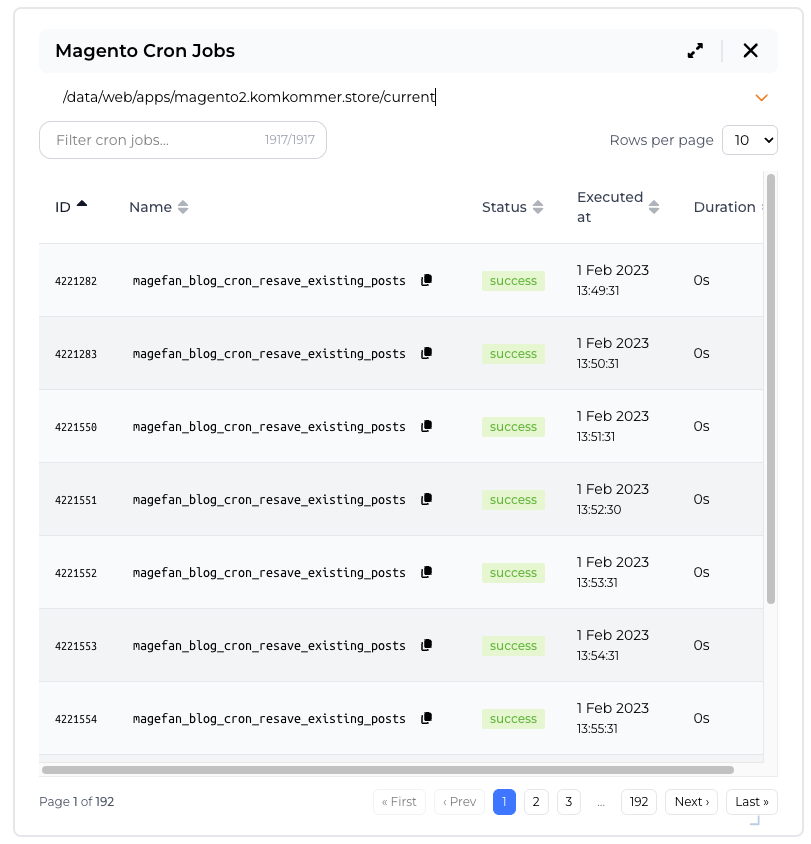
Magento Cron Visibility
Monitor your Magento cron health from inside your dashboard. Using automated installation detection, this new dashboard card aggregates and displays current cron jobs in a structured table format. To enable, simply add the card via the “Add Metrics” menu in your Hypernode dashboard.
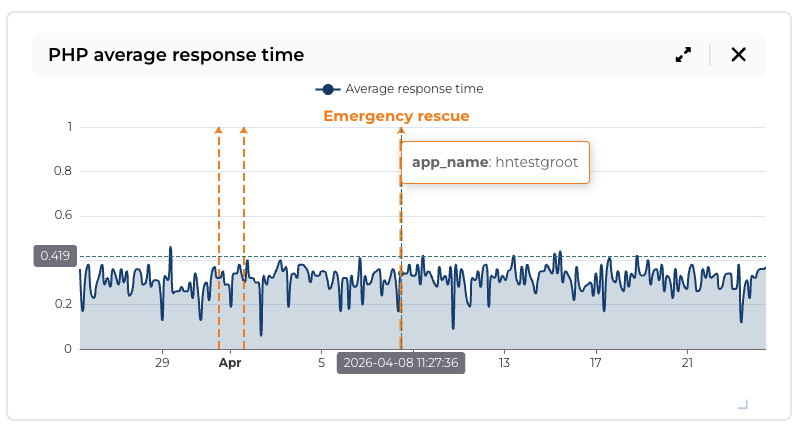
Annotations
Insights metric charts now show annotations marking notable events on the timeline, making it easier to correlate spikes, drops, and anomalies with what was happening on your Hypernode at the time.
Automatic annotations are added for selected system events, they appear automatically on the relevant charts within the event’s time window, scoped to the metrics they affect.
Sortable Dashboard Tabs
You can now fully customize your workspace layout with sortable tabs. Reorder your dashboard views instantly by clicking and dragging a tab to your preferred location.
Bug fixes and improvements:
- Removed redundant API calls for better performance.
- Refactored the Tabs logic to be more robust and performant.
- Added UX improvements around the loading indicator for cards.
- Fixed bug that made the dashboard re-render unintentionally.
- Fixed bug where the Tabs content sometimes did not update properly.
- Reworked the icon loading system to be more performant.
- New icon for OS information.