

At Hypernode, we constantly look for opportunities to improve our platform. In a proactive approach for the coming holiday season, we’ve been benchmarking our platform to find possible improvements of our Hypernode setup. Here is a list of changes that we’ve made to our platform that give a significant improvement of response times and reduce error rates on your Hypernode.
PHP workers to CPU core ratio
Our ratio of PHP-FPM workers to CPU cores has always been 5 PHP-FPM workers to 1 CPU core.
We noticed a recurring pattern in our benchmarks where our ratio of PHP-FPM workers turned out to be suboptimal.
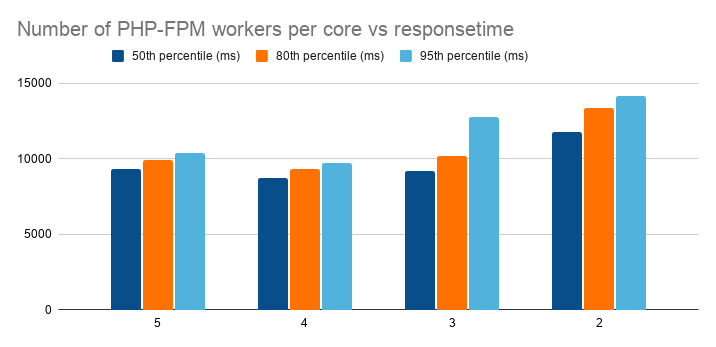
Based on our benchmark results (in the graph above), we found that a ratio of 4 PHP-FPM workers to 1 CPU core is the most performant of all tested ratios. On average, this lead to a response time that is 5.9% faster than it used to be with a ratio of 5 PHP-FPM workers to 1 CPU core.
The reason for this increase is probably because too many processes cause the server to keep context switching instead of actually serving requests.
This change in PHP-FPM worker to CPU cores is live since October 27th on all Hypernodes.
CPU priority for Nginx and Varnish
We’ve noticed during our benchmarks that when we applied a high load to the Hypernode, the load of the server went up so high that it was bottlenecked on the CPU. At that point, the CPU scheduler has to make decisions what to spent its time on.
When your Hypernode is experiencing a high CPU load, you want to ensure that most of the requests coming to your Hypernode will still succeed. In order to achieve this, we want to deliver as many cached and static requests as possible, because these don’t impact the CPU as much as dynamic requests.
Cached and static requests come directly from Varnish and Nginx, so we want to increase the priority of these processes in the CPU scheduler. We do this by changing the CPUWeight of both Varnish and Nginx, and use nice to set the priority of all services on the Hypernode.
Increasing CPUWeight
We’ve increased the CPUWeight of Varnish to 200 and for Nginx to 400. The default value for all services is set 100.
This change makes it so that the available CPU time, which is split up amongst all service units in a slice, will have an increased share towards Nginx and Varnish.
The reason we have applied this change is to ensure Nginx and Varnish have a larger share of system resources to make sure that more requests can be served.
You can verify this change by checking the cpu.shares value on your Hypernode:
root@wifamk-testfarzad-magweb-cmbl ~ # cat /sys/fs/cgroup/cpu,cpuacct/limited.slice/php7.0-fpm.service/cpu.shares
1024
root@wifamk-testfarzad-magweb-cmbl ~ # cat /sys/fs/cgroup/cpu,cpuacct/limited.slice/nginx.service/cpu.shares
4096
Use nice on all managed processes to manage CPU priority
The command nice can be used to specify what priority a process should get from the Linux kernel scheduler. Processes with a higher priority are scheduled to be executed before processes with a lower priority. You can specify a value from -20 to 19 with nice, where -20 is the highest priority and 19 is the lowest priority. All processes default to a nice value of 0.
We want to assure that Nginx and Varnish get the most priority when there is a high load on the shop, so we specify the CPU priority with the following nice values:
- Nginx, Varnish gets a
nicevalue of-15 - Other important services such as PHP, MySQL,SSH, Postfix, etc keep the default
nicevalue of0 - Observing services such as telegraf get a
nicevalue of10 - Log shipping services such as log-courier get a
nicevalue of15 - Services that are used irregularly like sftpd, fail2ban, ntp, nginx-config-reloader get a nice value of
19
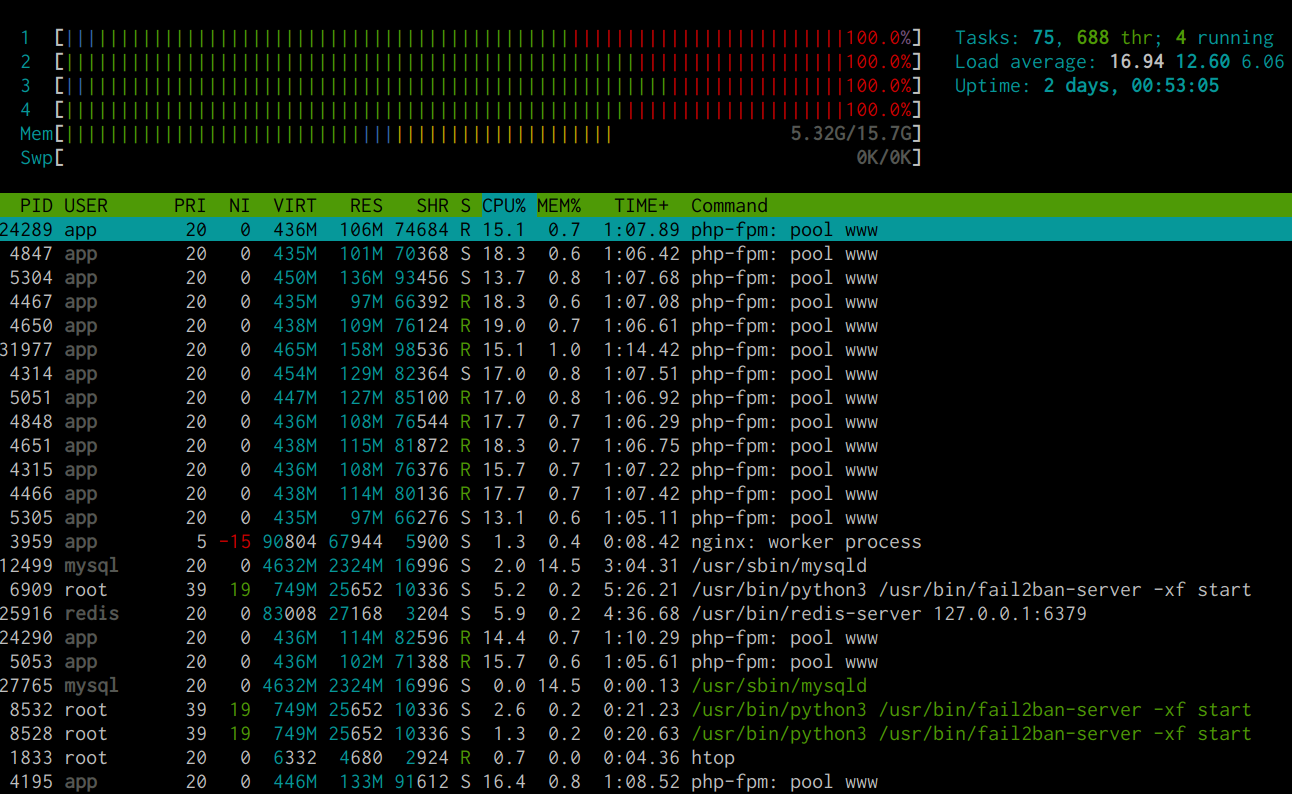
You can see the nice value using either top or htop on your Hypernode; check the 4th column NI to see the corresponding value.
Caching Hypernode monitoring requests
Three of our heartbeat servers will make a request to your Hypernode every 2 minutes. This does a series of checks which includes checking if all critical services like Nginx are still running, checking the available space left on your root disk, etc. Read this article for a detailed explanation of what our monitoring does
This monitoring is critical for our platform to ensure our systems can act upon any issues that are found on your Hypernode. However, when your shop is in a critical state where all resources are needed to serve requests to your users, we don’t want to cause any more load on your Hypernode than necessary.
We started caching monitoring results of any system checks that happen. When our first heartbeat server checks the status of your Hypernode, it does a check-up on all system services as usual. However, the second and third heartbeats will receive a cached result that is valid for one minute. This prevents any duplicate system checks within the span of a minute, but will still keep checking if Nginx and PHP are up and running as intended (because these services will still have to respond to the monitoring requests).